-
Notifications
You must be signed in to change notification settings - Fork 101
New issue
Have a question about this project? Sign up for a free GitHub account to open an issue and contact its maintainers and the community.
By clicking “Sign up for GitHub”, you agree to our terms of service and privacy statement. We’ll occasionally send you account related emails.
Already on GitHub? Sign in to your account
Possible feature request #26
Comments
|
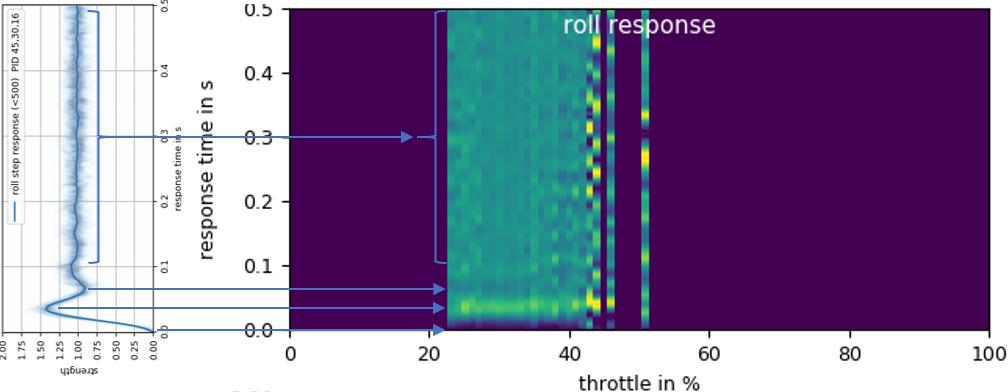
Awesome!! But I can't understand what those colorplots' color mean. |
|
blue=0, green=1, yellow=2. It's exacty the same range as in the response plot. |
Sign up for free
to join this conversation on GitHub.
Already have an account?
Sign in to comment

Hey,
First let me say thank you for this pretty awesome piece of software. I have been using for several months and I am glad to see it gaining interest lately.
I've personally been using the PID analyzer to analyze vibration more than PID tune and found that to some extend it was possible even though it wasn't really designed for it. The new filter/noise graphs are very helpful and pretty intuitive to analyze.
Back to the PID graphs, I like how you separated the slow and fast input on the bottom graphs, and I am wondering if something similar could be done (to this graph or new ones) in order to help tuning TPA. I know you recommend to turn off as many parameters as possible for the initial tune and I get that. But I am wondering if overlaying several gyro responses for different throttle value could help figuring out some of the vibrations caused at various throttle ranges.
I haven't looked at your code but I suppose it should be possible to input a throttle range in the command line such as: Min Throttle, Max Throttle. With default set to 1000 and 2000, that way someone who doesn't care about this could get the analysis done on the full range, and those who are trying to refine the tune around a specific throttle range could be able to set their min and max and get an analysis that is more focused around this range.
I definitely like the direction you're heading with the new Noise graphs. While I feel like PID tuning is probably easier now than before (thanks to Plasmatree and improvements of the firmware/PID loops, etc) some vibrations due resonance, or various mechanical problems can be tricky to solve, and good analysis tools can go a long way.
Cheers,
The text was updated successfully, but these errors were encountered: