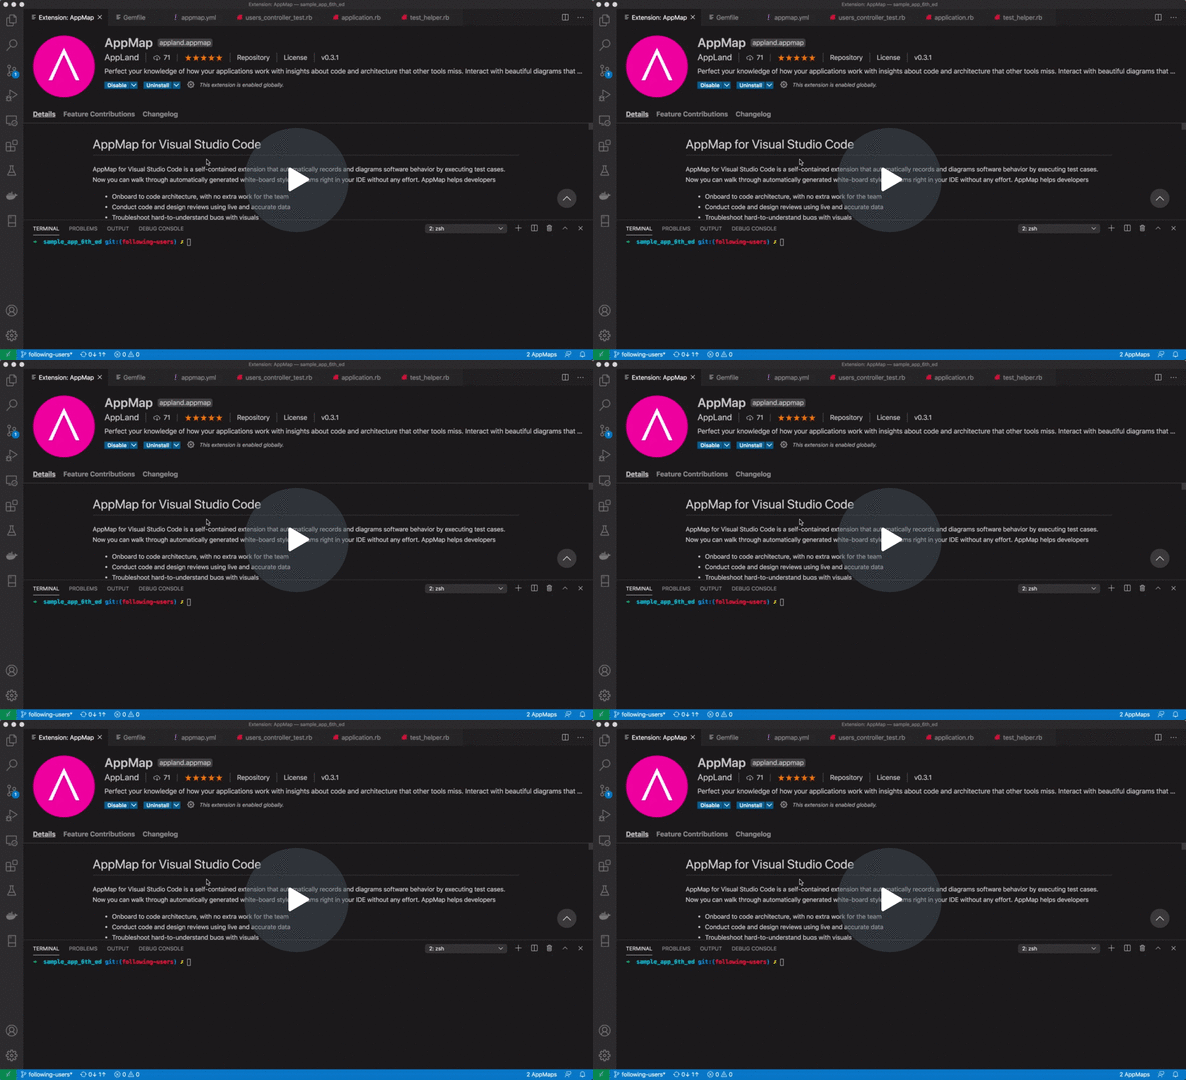
Navigate your code more efficiently with interactive, accurate software architecture diagrams right in your IDE. In less than two minutes you can go from installing this extension to exploring maps of your code's architecture. AppMap helps you:
- Onboard to code architecture, with no extra work for the team
- Conduct code and design reviews using live and accurate data
- Troubleshoot hard-to-understand bugs using a "top-down" approach.
Each interactive diagram links directly to the source code, and the information is easy to share.
Join us on Discord, GitHub or contact us on [email protected].
- UML-inspired Dependency Map that displays key application components and how they are interrelated during execution
- Execution Trace diagrams that visualize code and data flows
- List of Web services generated automatically from executed code
- List of SQL queries generated automatically from executed code
- Code linkage of the diagram to the source code
- Filtering by class, package or function
AppMap records behavior of running code as AppMap files during code execution and visualizes them in interactive diagrams.
Here's how to get going:
This extension is officially listed on the VSCode Marketplace.
To generate AppMap files, an AppMap client must be installed and configured for your project.
The appmap package is on GitHub at https:/applandinc/appmap-python.
View installation instructions for appmap-python and a step-by-step tutorial.
Visualize the architecture of your Python app, in VS Code, in 2 ¹/₂ minutes - Watch Video
Supported languages and frameworks
Python 3.5 and newer, Django, pytest, and more.
The appmap Ruby gem is on GitHub at https:/applandinc/appmap-ruby.
View installation instructions for appmap-ruby
Visualize the architecture of your Ruby app, in VS Code, in 2 ¹/₂ minutes - Watch Video
Supported languages and frameworks
Ruby on Rails, Minitest, RSpec, Cucumber, and more.
The appmap Java agent is on GitHub at https:/applandinc/appmap-java.
For Maven projects, we recommend using the AppMap Maven plugin, see the step-by-step tutorial.
For other than Maven projects, view installation instructions for appmap-java.
Visualize the architecture of your Java app, in VS Code, in 2 ¹/₂ minutes - Watch Video

Supported languages and frameworks
Spring, JUnit, TestNG, and more.
The Maven appmap plugin saves .appmap.json AppMap files in the target/appmap folder of the project. This folder is usually included in the .gitignore file and excluded from file search in the default Visual Studio Code configuration. To enable searching for AppMap files by their name and extension, update the search settings:
SHIFT CTRL|⌘ P, then typePreferences: Open Settings (UI)and pick the matching item from the results- Enter
use ignorein the search field and unselect theSearch: Use Ignore Filescheckbox.
Open an AppMap file in Visual Studio Code to view diagrams of the recording.
Use AppMap extension command AppMap: Open most recently modified AppMap to open the AppMap file that has most recently changed. When you have run and recorded a single test, this will be the AppMap for that test.
Alternatively, open any generated .appmap.json file directly from the file tree navigator.
Depending on the executed code and functionality covered, you should see a viewer with a diagram similar to this one:
The “Details” panel on the left hand side will be used when you click on something, such as a package or class.
“Filters” is used to type in the name of a particular object, such as a class, and focus the diagrams on that class. When you are brand new to the code base, you may not have any particular class names in mind, but as you use this tool in the future, perhaps to troubleshoot a bug, you may have a better idea of exactly what you want to look at, and Filters can help with that.
This is a view of the code, grouped into classes and packages, that was actually executed when the AppMap was recorded. When a class calls another class, the result is a link (edge) connecting them, with an arrow denoting the call direction. Keep in mind, this data isn’t coming just from a static analysis of the dependencies in the code (e.g. import and require statements). It’s coming from the actual execution trace through the code base.
SQL queries are denoted by the database icon. You can get specific details about SQL by switching to the Trace view.
Click on a class in the Dependency Map, then choose one of the functions, then choose an Event in which that function is used, then click on "Show in Trace view"
This will open the Trace view.
Each node (box) in the Trace view represents a specific HTTP server request, function call, or SQL query which occurred in the executed code. You can think of it like having the data from a debugger, but you can jump to any location in the call graph. The Trace view flows from left to right and top to bottom as the program moves forward in time.
Trace sub-graphs can be expanded and collapsed for easier navigation. Use the arrows keys ←↓↑→ to move between nodes.
The diagrams are fully interactive; they aren’t static pictures like UML. You can:
- Expand and collapse packages
- Click on edges to view detailed information about dependencies between components
- Click on classes to view detailed information about that class
- List the functions of a class which are used by the executed code
- Explore callers and callees
- View variable names and values at any point in the code flow, clicking on a variable in the Trace view
- View SQL queries
- Open source code right to the line of any particular function, by clicking on “View source".
Watch demonstration video
App.Land is a free single user sandbox that can be instantly used as an AppMap repository and as a collaboration and sharing tool for your team.
- Sign-up for App.Land, create an account for your organization
- Follow these instructions to install CLI tools and upload your AppMap files to the App.Land server
- Open and share your AppMaps from the App.Land UI. You can make the shareable links public for sharing with other members of your team.
To share your AppMaps with your team more directly and privately, contact us about team and enteprise App.Land accounts or go to AppLand.com.
Generated AppMap files can be viewed by others with the AppMap extension. So, one option for sharing is to simply send the appmap.json file to your colleague.
The easiest way to share the diagrams with a wider audience is via screencasts, recorded screen videos and screenshots. Here are some tips:
- Use the built-in screencast mode that will help your audience better follow your mouse and keyboard actions
- There are many great tools for recording and sharing screen videos. To mention a few:
- Loom, a favorite tool in many teams
- ScreenToGif, a simple yet powerful OSS screen recorder for Windows
- LICEcap, an OSS screen gif recorder for macOS
- The Marketplace lists extensions for screen recording
Recording large, complex applications can lead to acquisition of extraneous utility details that are not valuable for understanding how the application architecture works. If your AppMaps get too large, fine-tune the appmap.yml configuration file:
- Download and install AppLand CLI tools (only follow step 1 in the instructions)
- Refine your AppMap configuration
Then re-run the tests or re-record new AppMap files with the updated configuration.
Simply share your appmap.yml configuration file with others. Use of a git repository is recommended for tracking and sharing updates among members of your team.
Join us on Discord, GitHub or send email to [email protected].
AppLand has other solutions which help you profile and automatically diagram software through dynamic analysis, without relying on test cases. Please see the documentation of the AppMap clients for details about remote recording:
- Instructions for Ruby applications
- Instructions for Java applications
- Instructions for Python applications are coming soon
We have also hosted analytics solutions to analyze code architecture over entire codebases and across multiple releases. To learn more about these solutions go to AppLand.com or contact us.
Please visit the AppMap wiki in GitHub.
- Learn how AppMap technology works: appland.org.
- Blog


