Boot Dashboard
Well known from previous generations of the Spring Tool Suite, the Spring Tool Suite 4 also contains the boot dashboard for quickly running, re-starting, tagging, and inspecting Spring Boot projects in your workspace.
Please note, that this documentation applies to Eclipse only. There is however also a similar (but simplified) Vscode extension provided by Microsoft.
Spring Boot is now a widely adopted technology to simplify your life when implementing Spring applications for the enterprise. Especially suitable for creating microservice-based applications, it has changed the way we think about small and easy to configure Spring applications dramatically. Together with Spring Cloud, it opens the door to truly cloud-native applications, composed out of probably many microservices. This creates a need for developers to be able to easily work with not just one, but many Boot applications simultaneously in their IDE.
This realization was the starting point for the Spring Boot Dashboard. Its focus is to help you deal with a potentially larger number of Spring-Boot-based microservice applications and make your life as a developer a lot easier when working on those projects in your IDE.
The Spring Boot Dashboard comes as an additional view in STS/Eclipse. It is opened automatically in the Java perspective. You can also open it by pressing the Spring Boot button in your main toolbar. It opens up a simple view that is in sync with your workspace projects, showing those projects of your workspace that are Spring Boot projects.

The main purpose of the Boot Dashboard is to give you quick access to the things you do every day, every hour, or even more frequently. You can quickly start your boot apps (in run or debug mode) by selecting them in the boot dashboard and pressing the "run" or "debug" action in the toolbar. There is no faster way to launch your boot app than this. And since you probably are going to change code and want to restart your app, the action lets you restart your boot app, if it is already running. Change your code, press the "run" button in the boot dashboard, and your boot app gets stopped and restarted for you. Again, a simple one-click action.

The great thing about these actions (and many more) in the boot dashboard is that they operate on single or multiple projects at the same time. If you want to start or stop a bunch of boot apps at the same time, for example to startup a set of collaborating services, just select them all in the dashboard and press "run". That's it.

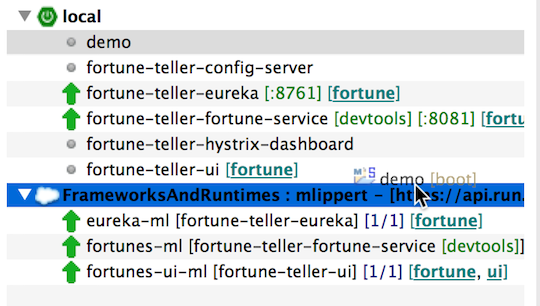
As soon as your boot app is being started, the boot dashboard visualizes that the app is starting - and it distinguishes between its startup phase (the VM is running, but the app is still initializing) and it is truly running and ready to use. The progress icon indicates the app is still starting up, the green "up" icon shows up as soon as the app is fully initialized and running. You don't need to observe the log output until some "server started" message shows up or something like that. The boot dashboards icons will let you know.

Once the app is running, the port that it listens is displayed - for your convenience. You don't have to scan the log output anymore to find out what port is being used by the app. The dashboard displays that information automatically. And in case you would like to jump to the console output of a running boot app, there is a quick action for that as well.
Often there is no need anymore to know about the port of a running app - since you don't have to open a browser tab for the app yourself. Double-click on the project in the boot dashboard and it will open a new browser tab for you - directly navigating to the apps default URL.

By default, this opens an Eclipse/STS internal browser view. If you prefer to use an external browser, you can set this in the preferences.
By default, double-click will open the root url path '/' on your app. If this is not what you want, you can customize that. Open the properties view, select the project in the boot dashboard and enter the default URL extension that you prefer. The double-click will open the default URL of the app + your customized extension to it.

In case you are not sure what URL extensions your application defines, you can select the “Request Mappings” tab in the properties view. All the request mappings of the running app are listed - your self-defined ones at the top, the ones coming from libraries at the bottom of that list. Double-clicking on the URL extension opens a browser for that extension, double-clicking on the code pointer opens the corresponding file of your project in an editor and jumps to the line that defines the request mapping.

The more microservice projects you have in your workspace, the more likely it is that you don’t work on all of them at the same time. You would like to focus on a subset. In Eclipse/STS, you might have created a working set, for example. The boot dashboard allows you to tag projects with an arbitrary number of tags (again, in the properties view). Those tags can then be used in the filter box (at the top of the boot dashboard) to reduce the number of projects that show up in the boot dashboard.

Since STS 3.7.3 the Boot Dashboard supports multiple launch configurations per project. If a project has more than one associated launch config, then they will automatically show up as children of the project's node in the tree.

All the features of the boot dashboard work for those individual launch configs, as well as selections of them, in the ways you would expect. For examle, you can start/debug/stop them, either individually or in groups. You can jump to the associated console view, open a browser window for that running application, set a default path per launch config (in case you want to have different default path settings for your launch configs), tag them, and so on.
The project node in the dashboard also functions as a shortcut for all its children. It displays a quick summary of the individual launch configs and allows you to execute bulk actions on them, like start or stop them all at once.
To reduce clutter and to maintain the simplicity of the UI for the common case where there's just one launch configuration per-project, a 'Hide Solitary Launch Configurations' filter is applied to the Dashboard by default, but you can disable this filter if you wish:

A single configuration is created automatically when an app is launched. To help you deal with multiple launch configs for a project, the context menu provides some actions that allow you: to quickly open a launch config editor; to duplicate an existing launch config; or to delete one.

Tip: If you want to run multple instances of a single local app simultaneously (e.g. you want to bind multiple local instances of a service via Eureka), you can set the property server.port=0 to let spring-boot pick a port dynamically (otherwise all but one of your launches will fail because the port is already bound).
Nevertheless there might be some launch configs in your workspace that you do not like to see in the boot dashboard. For this case the Spring Boot launch config provides an option that hides it.

In this section we will move beyond local applications and take a look using the Boot Dash with remote apps deployed to a cloud runtime.
You can add a Cloud Foundry section to the boot dashboard clicking the big plus icon in the toolbar.

Once you entered your credentials and selected an org/space, a new section will appear in the boot dashboard, listing the apps that are deployed to this space on Cloud Foundry. You can see the name of the app as well as the number of instances that are configured and that are up and running.

The basic actions work for one or multiple apps on CF in the same or a very similar way to how they work for local apps. You can jump to the console output and it will appear in the console view of STS/Eclipse, you can start and stop apps, you can double-click them to get to a browser window for the running app, you can configure a default path for the app, and you can add/remove tags to/from those apps. You can even execute some of the actions (like start and stop) across targets, if you select multiple entries in the boot dashboard across those target sections.

In addition to the common actions that are suitable accross local and Cloud Foundry apps, there are also actions specifically for apps on Cloud Foundry. The boot dashboard allows you, for example, to delete an app entirely from Cloud Foundry, or to easily jump to the web console.

Up to here, we talked about existing apps on Cloud Foundry. But how do you get your apps deployed to Cloud Foundry? There are various ways, for example using the `cf`` CLI or the Concourse Cloudfoundry Resource. The boot dashboard offers you another option: you can drag&drop your Spring Boot application directly onto the Cloud Foundry target in the dashboard and it will deploy the Spring Boot app to CF. This is as easy as its sounds.
After dropping the app on the the CF target, a dialog opens that allows you fill in some details about how you want the app to be deployed.

Most of the properties for the deployment are specified using the standard
Cloudfoundry Manifest format that is also used by the cf push CLI.
The dialog lets you choose between two modes 'manual' and 'file'. With the manual option you are performing a one-time deployment. The properties are entered into the dialog but not saved anywhere after deployment is performed. With the 'file' option you can pick an existing deployment manifest from your workspace and the deployment parameters will be read from that file. In both cases you can edit the parameters in the dialog prior to pressing the OK button to proceed with the deployment.
At the bottom of the dialog is a option to 'Enable JMX Ssh Tunnel'. This tells STS to Activate JMX support in the app and, after the app is deployed successfully, create an ssh tunnel that makes this accessible locally over an SSH tunnel. This feature and its uses are discussed in more detail in this section.
Once the app is deployed, the boot dashboard will keep the association between the project in your workspace and the deployed app on Cloud Foundry (and will show this association in the boot dashboard).

Keeping the association between your workspace project and the app on Cloud Foundry makes changes to this app a lot easier. If you change the code in your workspace and press the (re)start button for the app on CF, the boot dashboard will automatically re-push the app (the changes) to Cloud Foundry.
Additionally, for an app deployed via the 'file' option, the contetns of deployment manifest in the file will be compared against the current state of the cloudfoundry deployment to check for discrepancies. This could happen, if either the contents of the file, or the state of the deployment has changed since the last time the app was deployed. If any discrepancies are found, you will be alerted of this via a dialog that highlights the differences. You are given the choice to either abort the deployment; or manually reconcile the differences before proceeding with the deployment.

Once you have deployed your apps on Cloud Foundry, you often don’t need to work on everything locally at the same time. Usually you focus on certain parts of the application and sometimes you would like to use use even both: some services running on Cloud Foundry and some services running on your local machine in your IDE. But how do they interact?
As an early experiment, we built a specific feature into the boot dashboard that lets you use all your services and apps on CF and have them call individual services running on your local machine. That way you can focus on individual projects of your landscape and continue to use Cloud Foundry for the rest of your world. You can quickly iterate and work on the code locally - and test it while working with the other parts on Cloud Foundry.
The way this works is: You have a service discovery mechanism for your microservices in place. At the moment we support the Eureka service discovery service for this feature. You can start your local Spring Boot app using a special action called “(re)start and expose app via ngrok”. Executing this action will (re)start your local app on your machine. At the same time the action will create a public visible tunnel to this app using the ngrok service. As a result, you get a publicly visible URL that routes all its traffic to your local machine and to the local Spring Boot app that is running on your local machine. The app is automatically configured to register with the remote Eureka using this publicly visible tunnel URL.

Clients to this service will now get this tunnel URL from Eureka instead of (or in addition to) the default instance of your service that might be running on Cloud Foundry already - and will call your locally running service instead of the one on CF. You can iterate on your local service quickly or even debug it.
This mixed deployment scenario is obviously not useful for production or team environments, where multiple people are using the applications on CF simultaneously. But this is extremely useful for testing and development environments.
In section we will take a deeper look at using the Spring Boot Devtools in combination with the boot dashboard.
For local apps, using the Spring Boot Devtools is straightforward. As soon as you add the Spring Boot Devtools to your project as a dependency (there is an easy menu option for that in the Spring category of the Project exlorer context menu) and start your app, it will listen for local changes to configuration and class files and kick a restart of the app for you automatically. You don’t even need to restart the app yourself, the Spring Boot Devtools will do that for you automatically. Since STS/Eclipse produces and updates class files whenever you save a file, all this happens automatically for you when working within STS.

This story gets more interesting if you run your Spring Boot apps on a remote runtime like Cloud Foundry. In principle, you can use the Spring Boot Devtools in such a remote setting as well, but it requires a bit more work. The good news is that the Spring Boot Dashboard helps you with that.
As soon as you deploy or restart (and therefore update) a Spring Boot app on Cloud Foundry (using the boot dashboard) that has the Spring Boot Devtools on its classpath, the boot dashboard will configure the boot app on CF for the remote usage of the devtools automatically. This includes primarily the setting of a remote secret - to allow remote devtools access to it.
Once the devtools-enabled boot app is running on Cloud Foundry, you can easily start the boot devtools remote client application for it. This client application runs locally on your machine and connects to the remote application on Cloud Foundry. It watches for file changes, uploads them to the app on Cloud Foundry and triggers a restart of the app on Cloud Foundry.

Since the remote client app will watch for file changes within the project on your local machine, you can continue to work within your IDE as usual. Changed files are automatically updated to the Cloud Foundry version of the app by the remote client app. The counterpart on Cloud Foundry will restart the boot app once those changed files are stored to the app on Cloud Foundry. This works for newly compiled source code as well as for changed resource files.
This allows you to achieve quick turnaround cycles when working on your project even if it is deployed to a remote cloud runtime.
It is possible to attach the Eclipse/STS Java debugger directly to a remote application and debug it just like you would a local application.
The process for attaching the debugger to a remote application can be somewhat tedious to setup manually. For a CF application, for example, it would involve steps such as:
- passing debug arguments to the remote JVM on launch
- establishing an SSH tunnel to the remote application to forward debug traffic to / from your local machine to the remote JVM.
- creating and properly configuring a remote debug launch configuration in STS/Eclipse to connect to the local tunnel.
- launching the remote debug configuration.
For applications deployed via the Boot Dashboard we make this process very easy. All you have to do is (Re)start your app in debug
mode from the Boot Dashboard by clicking the ![]() icon in the toolbar. When you click that button. The app
is restarted and all of these above steps are performed automatically. The restart may take a little while (as it involves re-pushing the app
to set the right launch parameters on startup). Just sit back and wait and eventually the app will be deployed, an SSH tunnel created
and the Eclipse Java debugger is connected to the app.
icon in the toolbar. When you click that button. The app
is restarted and all of these above steps are performed automatically. The restart may take a little while (as it involves re-pushing the app
to set the right launch parameters on startup). Just sit back and wait and eventually the app will be deployed, an SSH tunnel created
and the Eclipse Java debugger is connected to the app.

You can debug the application that is running on the cloud runtime in the same way as local applications, including setting breakpoints, inspecting variables, or even hot-swapping code.

Note while debugging remote apps in this way does work, you will notice a significant slowdown in debugging and the debu UI. This is caused by the tunneling of the remote debug protocol over the SSH tunnel. As an alternative, you might want to consider running and debugging the app locally and connecting it up with the rest of your application services via the ngrok tunneling feature that we described earlier.