GSoC 2018 Progress Report
HighStock (PR #89)
Implemented the HighStock feature in daru-view. HighStock along with all the core functionalities of HighCharts possess some additional features like range slider, scrollbar, navigator and scrollbar. For more details, visit this page.

HighMap (PR #92)
Implemented the HighMap feature in daru-view. HighMaps are the Highcharts for geo maps. In daru-view, HighMaps have been implemented as a plugin for Highcharts. For more details, visit this page.

Custom Styling CSS in HighCharts (PR #93)
In custom styling CSS, I have implemented the Styled mode for web frameworks but as there is no method to load CSS files in IRuby notebook, I have kept classic mode for IRuby notebook where some styling can be provided. For more details, visit this page.

Exporting HighCharts to different formats (PR)
Offline exporting is provided in web frameworks while right now online exporting is being provided in IRuby notebook. Four formats are supported (PDF, PNG, JPEG, SVG) to export the HighChart using the code. Need to have some discussion over whether to keep online or offline exporting in IRuby notebook.
For more details, visit this page.

Now, if some particular module is needed to draw a HighChart, it can be provided in the modules option. Examples.
ChartWrapper (PR #95)
With ChartWrapper feature, we can now use another option view which provides the facility to visualize only some of the columns. Also, it paves the way for ChartEditor to get implemented as ChartEditor only works on ChartWrapper. For more details, visit this page.

Import data from google spreadsheet (PR #88)
Through this feature, a user can create a GoogleChart by providing the link of the spreadsheet and can perform various queries on it. For more details, visit this page.

Improved the coverage of googlecharts.rb, highcharts.rb, plot.rb, table.rb and some other files.
- Rails example to import data from google spreadsheet in GoogleCharts.
- Rails example to demonstrate various examples of HighCharts, HighStock and HighMaps.
- Rails example to demonstrate custom CSS in HighCharts.
- Implementing some appropriate design pattern to load the modules and map data in HighCharts.
- As HighCharts supports multiple series in a single chart, we can add a feature to visualize multiple Daru::DataFrame and Daru::Vector in a single chart (Need to think how user will provide the data - maybe in the series format or some other).
In the next phase (till 10th July), I will put my effort in the implementation of the following tasks:
- ChartEditor
- Multiple Charts in a single row
- Exporting of GoogleCharts to different formats
- Toolbar (optional)
- Add listeners (optional)
- Introducing the third parameter (for user options).
- Transfering js files to assets folder (Refactoring of rake tasks).
ChartEditor (PR #96):
The ChartEditor class enables the user to customize the chart through the in-page dialog box. This dialog box provides numerous features to edit the chart at runtime. For more details, visit this page.

In IRuby notebook, the dialog box appears behind the elements of the notebook. I have tried some ways to figure this out (refer) but the problem still persists.
Multiple Charts in a single row (PR #97):
With this feature, a user gets to simultaneously compare its visualization with different chart types and adapters (GoogleCharts, HighCharts and NyaPlot).
For more details, visit this page.

Exporting of GoogleCharts (PR #98):
GoogleCharts official JS does not provide any way to export the chart. However, we can have access to a PNG image of a chart (only corecharts and geocharts) using the getImageURI() method. By creating a dummy element, I have managed to export the chart in PNG format, however, it is difficult for other formats. I tried other formats (jpg and pdf) in this PR but they do not work in IRuby notebook (see this blog).

Handling Events in Google Charts (PR #100):
This feature provides a user with the facility to write their own javascript code in Google Charts in the form of events and listeners. This improves the interaction of the user with the visualization.
For more details, visit this page.

Refactored rake tasks to move dependent js and CSS files to the assets folder.
Add access_row_tuples_by_indexs in daru (PR #463 in daru):
Faced with a critical issue in daru-view unexpectedly as Travis was failing. This happened because a public method access_row_tuples_by_indexs was removed from the daru repository. This method was used in daru-view, so it needs to be reverted.
Visit this page for the detailed explanation. Numerous updations have been done in DataTables to carry out the following tasks:
Earlier, data was converted in the form of HTML table. This had the limitaion that only ~5000 rows can be added in the DataTable at a time (refer). Things got better when I shifted to javascript array for the further server-side implementation (as datatable can take Array of Array).
Resolved this issue in DataTables:
There was an issue the datatables that all the tables were overwritten by the last drawn table. This has been resolved now.
I have implemented server-side processing (using ajax option in DataTables) in DataTables for more than 50000 data rows and client-side processing below that. This is done because server-side processing searching is not done properly.
This feature enables the user to load millions of rows in the table.
Lots of updating and refactoring was done to improve the API of daru-data_tables.
These methods allow the exporting of HTML code of the DataTable in a file.
Testing and documentation were the need of the hour in daru-data_tables. Along with tests in daru-data_tables, I added specs and documentation for the datatables adapter in daru-view.
To demonstrate the features of this gem, I added some rails examples in the same.
Formatters in GoogleCharts (PR #110):
The Google Visualization API provides formatters that can be used to reformat data in a visualization. These formatters change the formatted value of the specified column in all rows. There are six kinds of formatters available right now: Arrow, Bar, Number, Date, Color, and Pattern. For more details, visit this page.

Added a method to load dependent scripts for multiple adapters (PR #107):
I have added the method dependent_scripts to load the dependent script for multiple adapters at once in both IRuby notebook and web frameworks. Have a look at these examples.
Rake Task to add new adapter templates (PR #112):
Added a rake task to generate the sample template for the adapter. The template contains all the necessary methods to add an adapter like init, div, init_script, init_ruby and export_html_file as TODO.
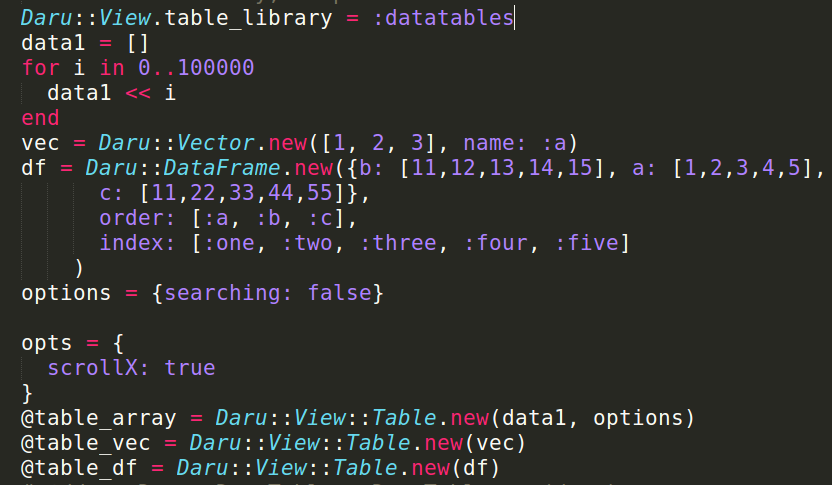
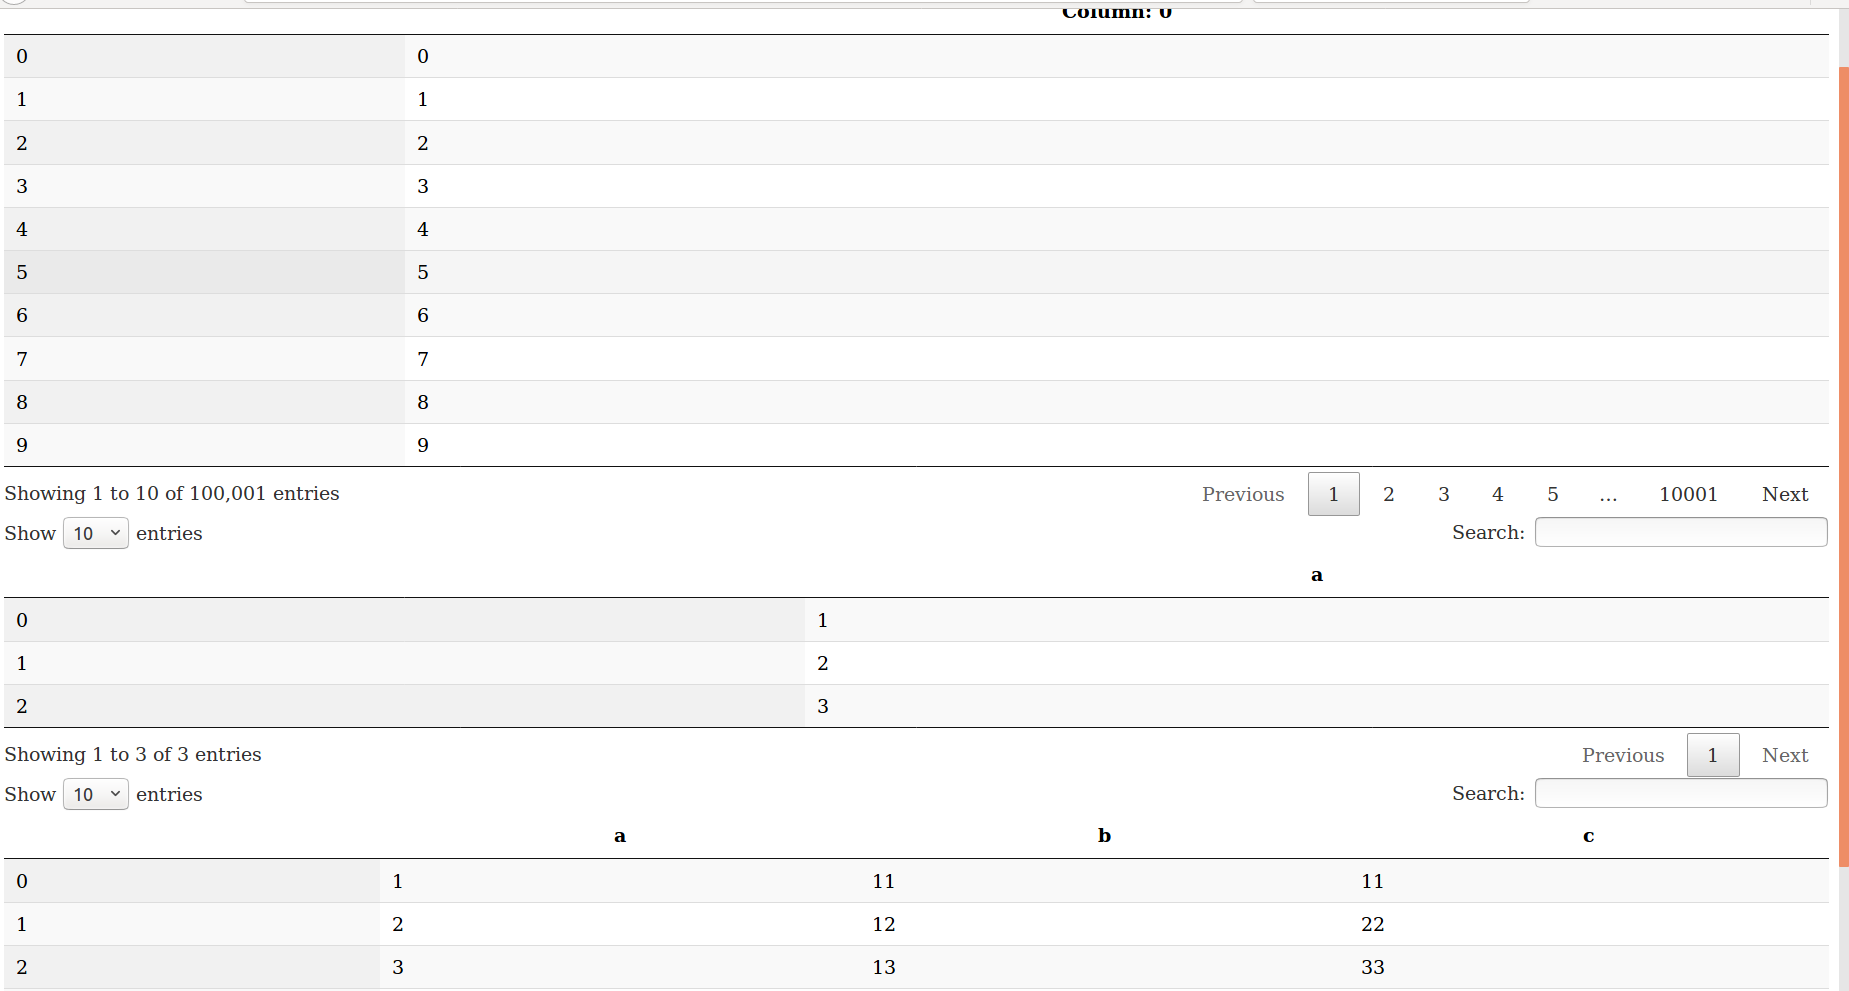
Rename Daru::DataTables::DataTable to Daru::View::DataTable (PR #114 in daru-view, PR in daru-data_tables):
As daru-data_tables is a plugin gem for daru-view, it needs to be initialized in a different way. Now, it can be instantiated as Daru::View::DataTable.new(data, options).
Add this code in controller:

to generate this DataTable:

Reduce a bunch of lines due to JS files in source HTML in rails (PR #115 in daru-view, PR #23 in daru-data_tables):
This aims to remove a bunch of lines that occur in the head tag in rails. In rails, the one line of code we actually need to write in daru-view is for a class called Engine, this is going to inherit from Rails::Engine, and this is more or less saying that when rails loads this gem, it's going to look for this Engine class, and if it's defined, it's going to treat this gem's directory structure a little bit differently. It's going to work sort of like your rails application, almost as if you had a rails app inside of a rails app.
To carry this out, dependent JS and CSS files are shifted to vendor/assets/javascripts and vendor/assets/stylesheets respectively, so that, JS can be included in the app/assets/javascripts/application.js file as:
//= require highcharts/highcharts
//= require highcharts/highcharts-more
//= require highcharts/map
//= require jquery-latest.min
//= require jquery.dataTables
and CSS files can be included as:
*= require jquery.dataTables
Include the below line in the head of the layout file:
<%= javascript_include_tag "application" %>
<%= stylesheet_link_tag "application" %>
Note: The previous method to use <%=raw Daru::View.dependent_script(:highcharts) %> will also work.
Right now this has only been done for rails. Other web frameworks do not provide much flexibility and there are fewer resources available to search. I am trying to reduce lines in Sinatra and nanoc too but still facing many difficulties. Loading JS and CSS files in the app (by keeping these files in the app) can be done, but loading these files from daru-view in the sinatra/nanoc/other frameworks is not an easy task. I have also opened this issue in the sinatra repo.
Improved code quality of the project by fixing various rubocop comments in these PRs and also during working in other PRs.
In demo_daru-view:
Rails examples:
- Importing data from google spreadsheet in google charts - #2
- HighCharts, HighStock, HighMaps examples - #3
- Custom CSS in highcharts example - #4
- ChartWrapper examples - #6
- Multiple Charts using PlotList examples - #8
- DataTables examples - #10
- ChartEditor examples - #9
- Formatters examples - #11
- Handling events examples - #12
Sinatra Examples:
- Importing data from google spreadsheet in google charts - #5 commit
- HighCharts, HighStock, HighMaps examples - #14
- Custom CSS in highcharts examples - #13
- ChartWrapper examples - #5 commit
- Multiple Charts using PlotList examples - #5 commit
- DataTables examples - #5 commit
- Handling events examples - #5 commit
- Formatters examples - #16
- ChartEditor examples - #17
- Added examples for various countries data - #18